
Google Analytics has a lot of great reports, but sometimes you’ll only want to see a small subset of your data. For me, that ‘sometimes’ is when I’m using the official Google Analytics app to see how my project is doing.
Creating a custom view for optimal use of the Google Analytics mobile app
Usually you’ll create a custom report or dashboard to look at a subset of your data. But on your mobile phone, speed is key. So all I want to see is how my project is doing on a higher level, and get to this data as fast as possible.
By default, the app shows you four widgets:
- Real-time: the amount of users currently on your website.
- Audience: the total amount of sessions of your selected time period.
- Acquisition: the traffic sources of your sessions.
- Behaviour: the amount of pageviews.
- Conversions: the goal completions.
To get to the data as quickly as possible, you’ll want to see the right data in this view instantly. For a quick view of your data, the collection of widgets is almost perfect.
The real-time part quickly shows me what’s going on. As I know my project inside out, I’ll instantly detect a spike in traffic. The audience part tells me how much traffic I had for the selected date range. Acquisition shows me how this traffic got to my site. The pageview data in the behaviour tab is something I ignore, because the total amount of pageviews don’t say anything in my project. And finally, the conversions, is where the app starts to shine if you set up a separate view.
Pick a main goal to make the analytics app shine
A standard Google Analytics view allows you to set up 20 goals. If you set up multiple goals, the conversions widget will show if users completed either one of these goals. You’ll have to tap the widget, dive into the conversions report of the app, and filter the correct goal to see the stats for one specific goal. That’s a step I don’t want to take.
To minimize the steps you’ll have to take, copy your main profile, rename it with something like ‘GA app view’, and turn off all goals except your main one. Now, if you select that profile with the GA app, the conversions tab on the starting screen will instantly show you how many completions that one goal had. No deep dive required.
For my app, I use it to track successful app uses, the view of a results page. Depending on your business, it can also show you transactions or submitted lead forms. You can always go back to your main view that has all the goals to further look into your data.
The result
To show you how I personally use the app, here are some screenshots for the ‘GA app view’ profile of my current project (a webapp):
Realtime
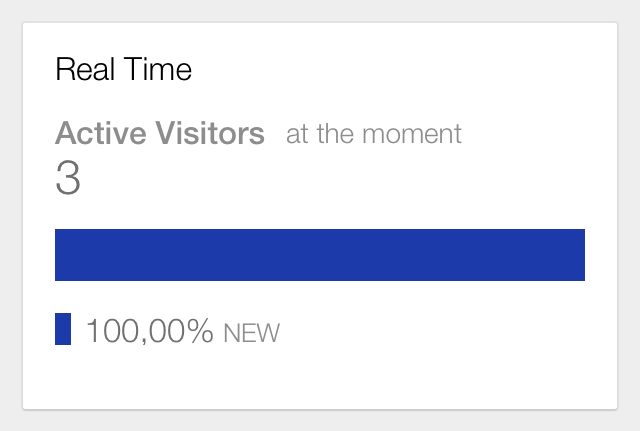
This number instantly shows if there are active users on my website right now. Normally, traffic peaks are around 7 or 8 in the morning and at 4 or 5 in the afternoon. I can quickly see how the app is doing at those two moments. The downside to this view is that all visits appear to be ‘NEW’, but my other data clearly tells me the greater part of app users is ‘RETURNING’. So there’s a little bug in this view.
Audience
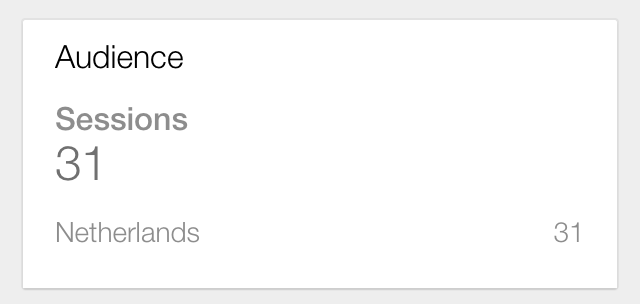
The audience part shows me the total sessions of my selected day period. I normally select ‘Today’ as the default, as I track my website and webapp performance throughout the day. I check this daily, so I know how the numbers compare to other days. As you can see, the numbers aren’t that high yet.
Acquisition
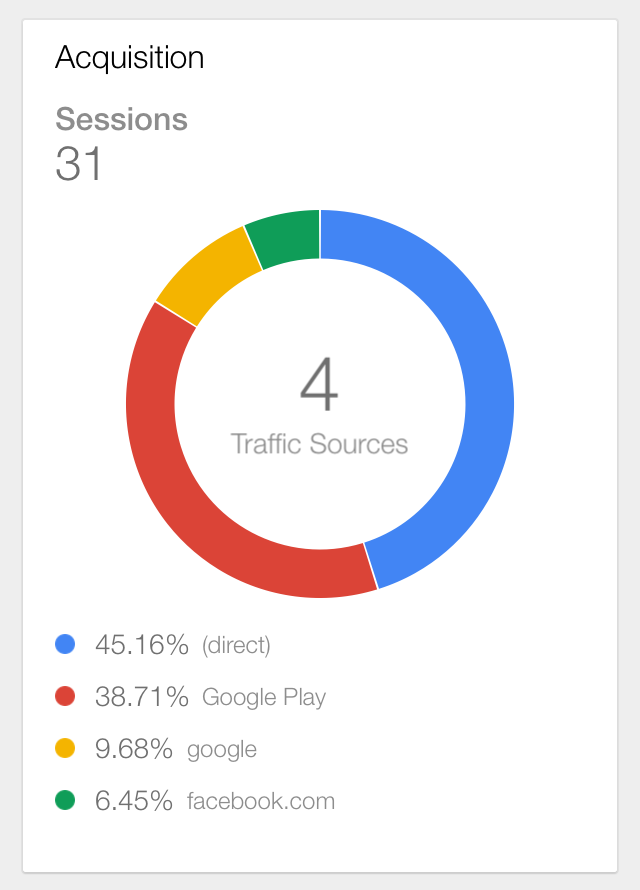
Of course, as an analyst, I also want to know where the sessions came from. Normally the Google Play (I have a converted webapp for Android) and direct (for the default webapp) show up here. On an acquisition day, which are days that have an influential social share, post on my website or blogposts on other sites, I’ll see other sources pop up, e.g. Facebook, LinkedIn or a referring domain.
Behaviour (I ignore this)
Conversions
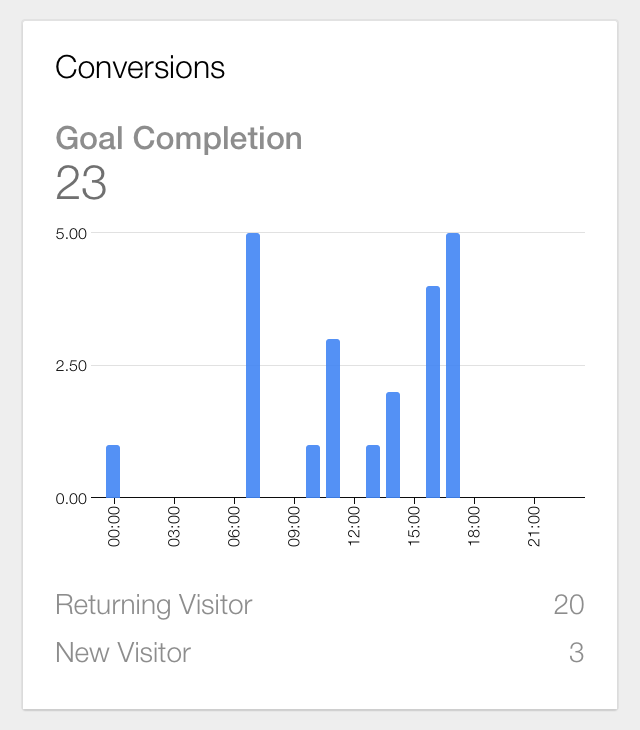
My app shows the time remaining until your next train departure (for the Dutch railway services). So as a main goal, I’ve set up the results page of those train times. This either appears after opening the app and configuring your settings, or instantly for returning visitors. It allows me to see how many of my session resulted in successful app uses, for both returning and new users.
So for this day, I had 31 sessions (at the time of the screenshot), 23 successful app uses, and 3 new app uses (oh yeah!). So even though the numbers aren’t high, the quality of traffic is good: 23 out of 31 sessions were successful app uses.
Final note
Of course, this might not be as useful when you have millions of sessions a day. But for your new projects, smaller projects, or for managing separate departments of your site, this is a quick & easy way to glance at the most important data in the Google Analytics app.
The Google Analytics app is available in the Apple App Store and Google Play.


Leave a Reply
You must be logged in to post a comment.