
If you’re a web analyst, and you’re really proud of a analytics solution or report, you might want to share that solution with others. The hard part is that the company, agency or startup you’re working for often doesn’t want you to share the data publicly. And if they do, they’ll require you to randomise the data. What if randomising your data set was as easy as opening a view in Google Analytics?
The hassle of generating randomised data
When people ask me to randomise a data set, I normally follow these four steps:
- Find or set up the report in Google Analytics.
- Export the data.
- Randomise the data.
- Display the data in a format totally different from the Google Analytics interface.
These are four steps that might discourage people from even thinking about sharing an awesome analytics solution. Luckily, there’s a way to generate this data set without any hassle.
A better way of generating randomised data
The solution to our problem is easy: create a random selection of data by excluding a percentage of IP addresses. At TMT, we’ve tested this with the following filter:
^.*((2[4-9])|(3[0-6])|(6[0-8])|(7[5-9])).*$
This filter will exclude all IP addresses that contain any number within the following ranges of numbers:
- 24-29
- 30-36
- 60-68
- 75-79
At the beginning of this year, we created a new view in our TMT Google Analytics account. After a test run of 16 weeks we found that this filter has excluded 20.6% to 24.6% of our sessions (22,9% on average), and 19.8% to 26.8% of our full reads (23,2% on average). Here’s a graph that gives you an idea of how the filter changes the session and transaction (full read) data over time:
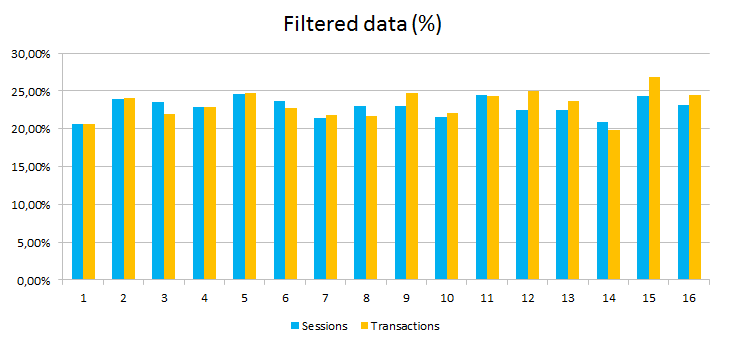
Filtered sessions and transactions of The Marketing Technologist per week.
The conversion rate is also an interesting number to look at: how does the filter change the performance of our website?
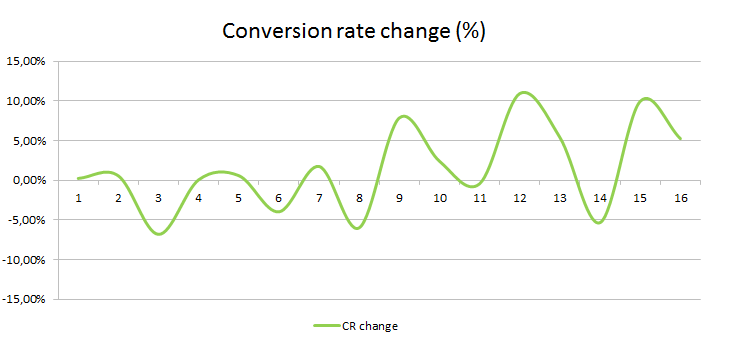
Change in conversion rate of The Marketing Technologist per week.
As you can see, the change in conversion rate ranges from -8.82% to +10.93%, the average change was +1.56%.
The average conversion rate for the standard profile was 35,6% over the 16 weeks, while the randomised profile shows an average of 36,2%. Though the number is different, it roughly shows the same performance as both numbers round off to 36%.
Is this the solution to sharing data publicly?
Looking at the results for TMT, roughly the same share of sessions and transactions are filtered out on average (it only differs by 0,3% over 16 weeks). This makes the conversion rate is roughly the same on a higher level.
The good thing is that when you trend your data per week, or pick a small date range to analyse, it won’t show your actual performance. And if you don’t share your randomised IP filter, there’s no way of knowing how big a chunk of data the reports you’re sharing are missing. So the filter certainly works for volumes, but it’s less effective for randomising performance.
What do you think about the idea of randomising a Google Analytics profile based on a range of IP addresses? Let me know in the comments.


Leave a Reply
You must be logged in to post a comment.