
Google Analytics is a powerful tool, but sometimes it’s hard to tell in what format an event is measured, or if a page view uses the actual URL for input or a virtual page path value. It’s especially hard when you weren’t involved in the measurement setup. This is why you should learn to check Google Analytics measurements. It’ll make it easier for you to find the right data.
The network tab is your friend
Every website needs to load content to show the actual website. This contains content that you’ll see directly, e.g. images and style sheets, and content you won’t see directly, e.g. data tracking scripts. Every browser allows you to see all of these items by monitoring network activity. In this post, I’ll focus on Google Chrome’s network monitoring, but you can monitor the network in similar ways with other browsers. Besides that, I will refer to Google Analytics’ Universal tracking method (if you have classic Google Analytics code running, replace any reference to collect by utm.gif).
Where to find your new friend
In Chrome, you can find the Network tab in the developer tools. You can open the developer tools in two ways:
- right-click on the web page, hit inspect, and select the network tab; or
- hit F12 and select the network tab.
If you ever plan on using the Network tab, make sure to open it before opening the page you want to check. If you open it after the page load, it will only register the activity that occurred after opening the tab (if you forgot, you can always refresh the page).
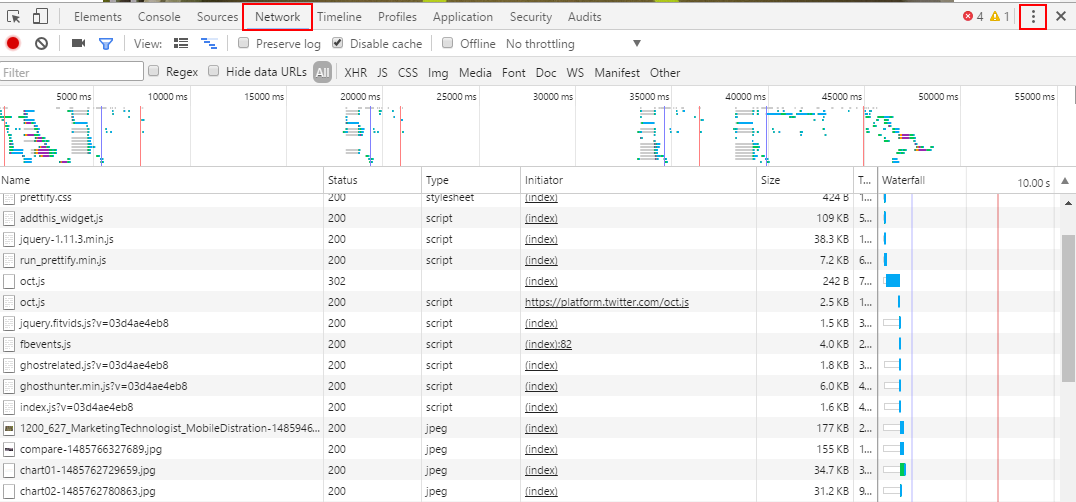
Screenshot of the developer tools. The Network tab and menu are highlighted in red.
You can use the menu of the developer tools to position the tools as you see fit (at the bottom of the screen, at the right side, or in a separate window).
Looking for Google Analytics activity
With the network tab open, you can look for collect to find Google Analytics activity:
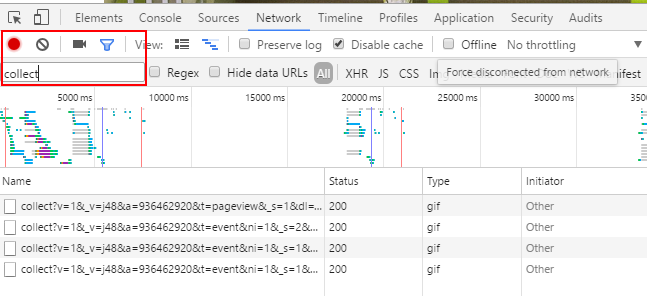
Screenshot of Google Analytics’ collect calls on TMT.
To view the details of the call, select one of the collect items, head on over to the headers tab and scroll down to the Query string parameters section:
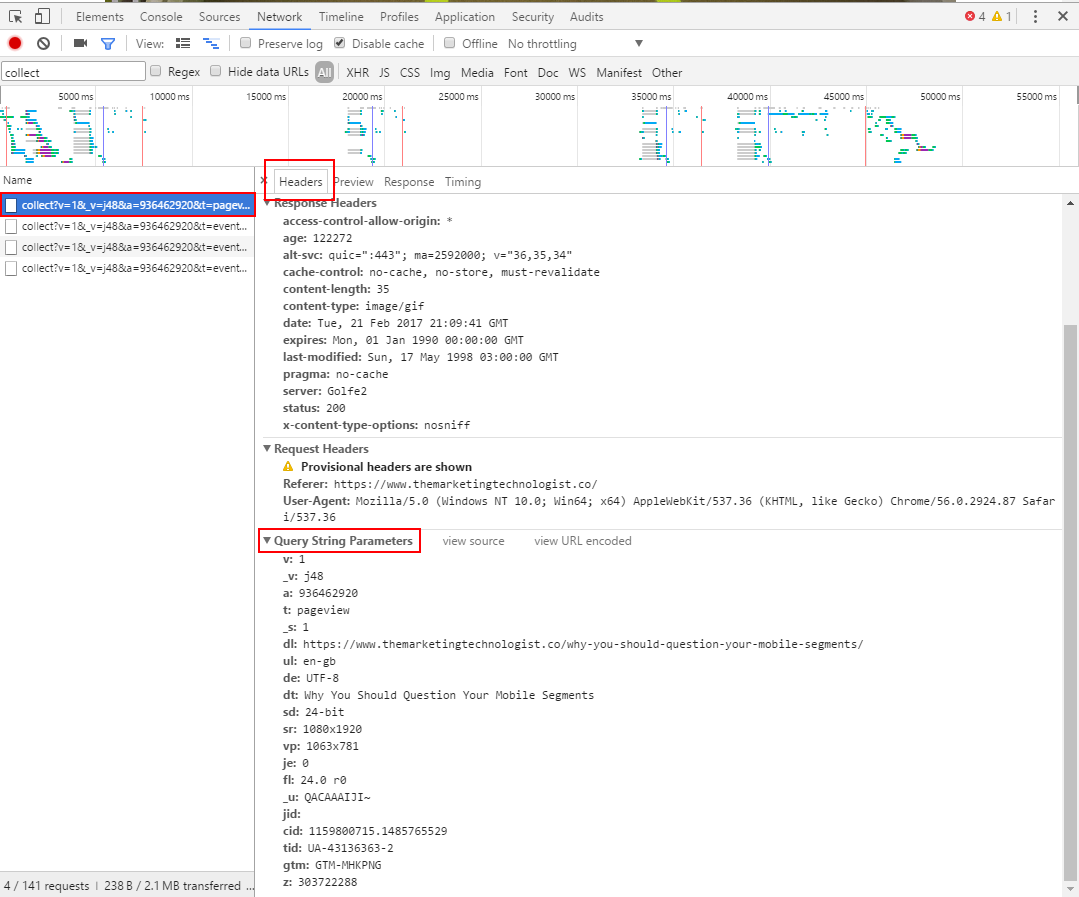
Screenshot of Google Analtyics’ page view call details on TMT.
This is where you see all the information Google Analytics collects from the web page. There’s a small collection of parameters that are important:
- general tracking information
t:– the hit type of the call. The most common values arepageviewandevent.tid:– the property ID the data is sent to.- page tracking:
dl:– the page URL that GA uses for page information (e.g. hostname and page);dp:– the page path. This value is optional. If it is sent, the value is used to register the page in GA instead of the actual page URL.- event tracking:
ec:– event category.ea:– event action.el:– event label.ev:– event value.ni:– non-interaction boolean. If the value is 1, the event doesn’t influence bounce rate.- custom dimensions and metrics:
cdX:– custom dimension X, where X is the index of the custom dimension, e.g.cd11.cmX:– custom metric X, where X is the index of the custom metric, e.g.cm2.
This will help you check your most common Google Analytics calls. Next up: e-commerce.
Checking e-commerce
To check you e-commerce calls, you need to know what type of e-commerce measurement revenue you are using:
Standard e-commerce
If you’re using standard e-commerce tracking, your e-commerce measurements have their own hit types: transaction and item. The transaction call contains the transaction information and contains the following important values:
t:– Hit type istransaction.ti– Transaction ID.ta– Transaction affiliation.tr– Transaction revenue.ts– Transaction shipping.tt– Transaction tax.
The item call contains the product information:
t:– Hit type isitem.ti– Transaction ID.in– Item name.ic– Item category.iv– Item variation.ip– Item price (per unit).iq– Item quantity.
The tid of the transaction call and the tid of the item call should match. If they don’t, Google Analytics is not able to link the items to the transaction.
Enhanced e-commerce
If you’re using enhanced e-commerce tracking, your e-commerce measurements are added to a standard event or pageview calls, similar to custom dimensions and metrics, and contain the following parameters:
t:– Hit type iseventorpageviewdepending on the hit you use to send e-commerce data.- Transaction information:
pa:– Product action. For a transaction, the value ispurchase.ti:– Transaction id.ta:– Transaction affiliation.tr:– Transaction revenue.ts:– Transaction shipping.tt:– Transaction tax- Item information:
prXnm:– The name of the product, where X is the number the item is in the transaction, e.g.pr1nmfor the first item.prXca:– The category of the product, where X is the number the item is in the transaction, e.g.pr1cafor the first item.prXid:– The SKU of the product, where X is the number the item is in the transaction, e.g.pr1idfor the first item.prXpr:– The price of the product, where X is the number the item is in the transaction, e.g.pr1prfor the first item.prXqt:– The quantity of the product, where X is the number the item is in the transaction, e.g.pr1qtfor the first item.prXcdY:– A custom product dimension, where X is the number the item is in transaction and Y the custom dimension index, e.g.pr1cd13for the first item.prXcmY:– A custom product metric, where X is the number the item is in the transaction and y the custom metric index, e.g.pr1cm13for the first item.
Because the information is added to one collect item, it doesn’t require a matching transaction id – ti – for the items that the standard e-commerce tracking does. You can check other enhanced e-commerce steps by looking for the pa parameter value of the corresponding step:
clickdetailaddremovecheckoutpurchase
Filtering for specific hit types
The search bar in the network tab allows you to use regular expressions that help you narrow down your search results.
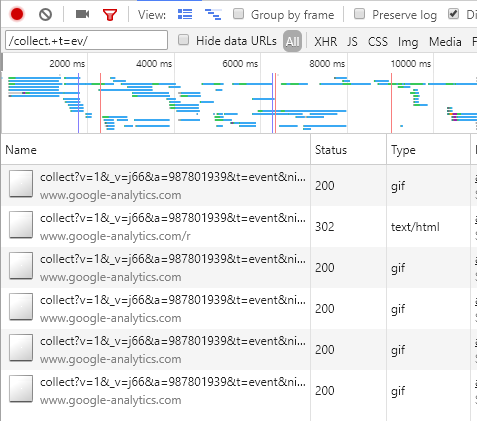
Screenshot of a regular expressions (regex) search in the network tab. Put the regex between / signs, e.g. /collect.+t=ev/.
Th regex will help you filter for specific hit types. You can filter for hit types with collect.*t=HITTYPE. Let’s look at some examples:
collect.*t=pageviewcollect.*t=eventcollect.*t=transactioncollect.*t=item
Similarly, you filter for product actions with the following regexes:
collect.*pa=detailcollect.*pa=addcollect.*pa=checkoutcollect.*pa=purchase
Debug a specific call
If you’re not sure if the measurement is coming through correctly, you can select the URL of the call:
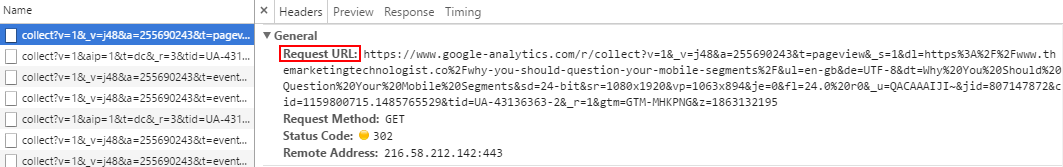
Screenshot of where to find the Request URL of a Google Analytics call.
and add /debug between google-analytics.com and collect. This will show you if the call is valid:
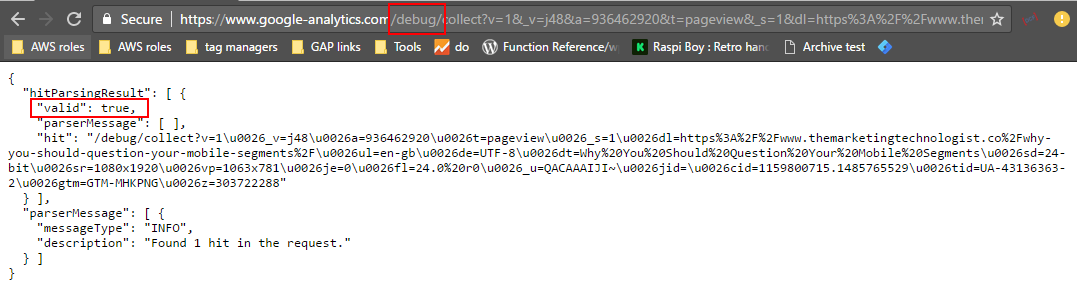
Screenshot of a valid Google Analytics call.
Benefits
Now you know how to debug Google Analytics measurements, you’re less dependent from technical people and capable of finding the right data by yourself. There are also browser plugins, like the Google Analytics debugger or Google Tag Assistant, but the network tab approach works for every browser and will always show you the exact data that’s sent to GA.
A similar approach works for most types of tracking scripts (e.g. Adobe Analytics). All you should know is the value that identifies the measurement calls in the network (what collect is for GA).


Leave a Reply
You must be logged in to post a comment.