
It’s funny how one week in Hungary can give you an overview of the current state of the digital analytics industry. For me, this year’s talks fell into two main categories: cool stuff you can do with data and taking care of our fundamentals. And just as last year, I left with a clear idea on what I should work on.
The cool stuff
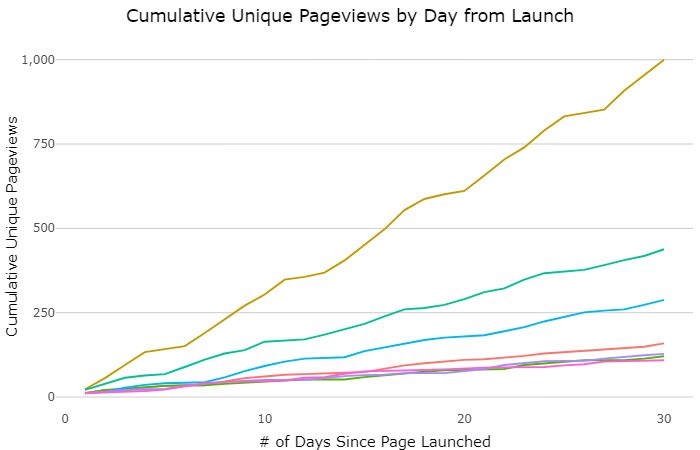
An analytics event would not be complete without some cool projects that can be done with data. Tim Wilson’s projects apply data science concepts to common tasks for analysts. He shared four examples (access them through: https://bit.ly/ga-and-r). I instantly applied one of them to this very blog: Time-Normalised Pageviews. It allows you to compare visits to a page from the moment it was published. It allows you to super easily compare pageviews over time. There’s also an option for a cumulative view of pageviews.
Here’s an example of analytics articles on our blog:
Matt Gershoff’s topic was entropy. In his talk, he used stories about winning the lottery (it’s only interesting when you win) and let’s play a game of 20 questions to explain the concept of entropy. What I liked most about his talk was this line:
Don’t love data. Love information.
Zoran Arsovski and Ivaylo Shipochky shared a very cool concept. They used a data feed of products (in their case MMA events) to automatically create and update search ads for Google Search, Bing and Yahoo over multiple countries through Search Ads 360. Pretty neat.
The cool stuff section would not be complete without mentioning the Gold Punchcard competition. Every Superweek Wednesday, visitors can share data projects they’ve worked on in the previous year. The audience votes for the best projects of that year. Damion Brown did a great write-up on the 2019 edition. I recommend reading that if you’re interested.
The fundamentals
No matter how cool the stuff your working in is, it’s only as good as the data you put in it. Or as Mark Edmondson said:
Good data with simple models are better than bad data with complex models
So how do you get to good data? It turns out it’s not that easy. With several talks being dedicated on how we should connect to the business more, we apparently still haven’t figured it out. Simo Ahava shared his general view on the topic: it’s all about communication systems. The very fact that we have tag managers is an example of this view. If the communication systems between marketing and development were perfectly in place, placing a tag would have been easy, and tag managers would not be necessary.
And we should not forget about data quality. Do you know the overall quality of your analytics data? Brian Clifton’s talk on the current state of Google Analytics data summed up the result of 70+ audits he ran. The current state of Google Analytics data is bad. He ended his story with a clear message:
Advanced web metrics is about doing the basics really well and applying it in a clever way.
When we look at our data, we always assume that the data is correct. Simo took time to clarify that we should never take it for granted. A data point can get corrupted on may different levels. To name a few:
- Tracking: is the data being collected in the right format at the right moment?
- Enrichment: can the data be processed by the analytics system?
- Filtering: how is data filtered?
- Report configuration: what data is included in a report?
Do you ever consider this when you look at a metric in a report? I don’t. He made a nice addition on data alignment across data sources: if you use multiple data collection systems (e.g. Google Analytics, Snowplow Analytics and Google Analytics for Firebase), do you know if page views in these three systems resemble the same thing?
Damion Brown summarised this topic when he said:
Sell trust in data.
If we can’t do that, what good is all the cool stuff we can do with data?
Bonus: data ethics
New this year were two talks on data ethics. It has become so easy to do cool stuff with data, we hardly take time to stop and think if we should do certain things with data. What has stuck with me the most is the comparison with Cambridge Analytica. For a data analyst it was an interesting data problem to solve. But in the end, the solution could also be used to do harm to a society. Many marketing activities are executed with a similar mindset: let’s see if we can do this. Shouldn’t we ask ourselves more often: if I get to a solution, how easy would it be to do bad things with it?
The Daniel Weisberg effect
For the second year in a row, Daniel’s talk summarised the week for me. He ended his talk with an Italian saying:
Traduttore, traditore!
It translates to:
Translator, traitor!
Daniel argued that analysts are translators. We turn data into stories. It’s a skill not many people have. It’s also our job to make sure the stories we tell are true. We should know our data well and trust the quality. So no matter how cool your story is, always make sure you trust your data.
It’s easy to combine this with my main takeaway of Superweek 2018: Take time to hang out with your data (2018). It will make you a better translator (2019).
Are you a traitor?
I don’t want to be a traitor. So my focus will be on making sure the fundamentals are in place. When they are, I will start looking at the cool stuff I can do with it.


Leave a Reply
You must be logged in to post a comment.