
What’s the true value of an online ad impression? It’s an ongoing discussion which continues to pop up.
Everyone agrees the last click model undervalues campaigns that fulfill an important role in the start of the buying cycle. Not every ad has to lead to a sale instantly. Most other common conversion attribution models only observe what happens after a click (see Eddie Borgers’ article for an overview of the most used standard conversion attribution models).
At the complete other end of the spectrum, you’ll find post view attribution, which commonly overvalues your campaigns. Creatives the customer hasn’t seen (when they get served below the fold for instance), are often getting undeserved value. Especially within performance aimed campaigns, this model is not recommended.
Does this mean a video or banner impression, that doesn’t lead to a click, is worthless? Absolutely not! No one ever clicked on a tv ad, have they? That doesn’t mean it doesn’t have any value. Intuitively people understand this applies to online as well, especially for high impact formats like billboards, videos, or takeovers.
The idea
I’m one of those number junkies. That’s why we went on a journey to find a way to quantify the value of an impression. We try to do this by looking at everything that occurs after the moment a creative is served, without it leading to a click. After this, we tie a relation with later website visits and / or (online) purchases.
The first obvious step is viewability. We look at the total time an ad is actually visible to a user. But we like to take it up a notch by looking at the user’s behavior from the moment he or she sees the creative. We do this with Kosi, a tool that can track any kind of interaction from within an online creative. With this tool we don’t just register clicks, but also interactions like swipes, scrolls, use of selectors, filling out a form, hover time, and total interaction time. Every interaction a user performs can be turned into insights through Kosi.
By creating a smart connection with Atlas tracking by Facebook, we’re able to measure post view results from different levels of interaction. The nice thing about the Atlas link is that it makes cross-device results available. This way we can create a connection between mobile banner interaction, and a later purchase on another device (also see my earlier article about Atlas insights).
This setup enables us to look at the indirect effect, since we were able to make links between the different levels of interaction, and later indirect conversions.
We tested this principle a few times in the real world. Every time it returns the same result. Users who interact, convert better.
The proof
We used a billboard game for our first test. The creative wasn’t meant for people to click and buy, but to let people play a game that was related to the brand. In this case it was "Koekhappen", meant for the Staatsloterij Kings Day lottery draw.
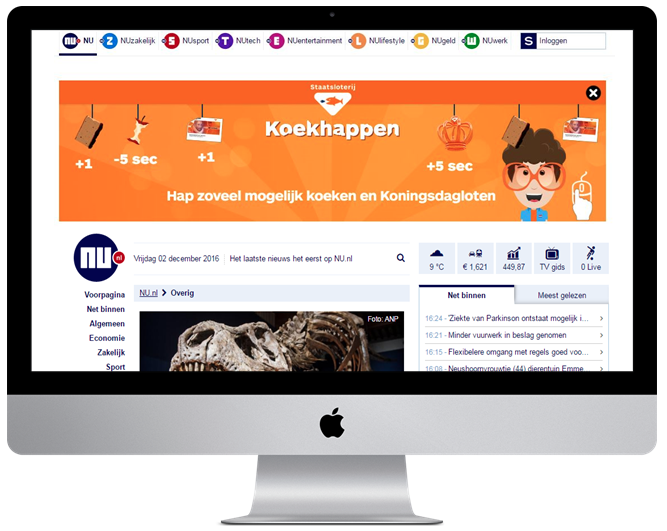
Subsequently, we looked at the difference in buying behavior between audiences who played the game, and those who didn’t. During analysis, we filtered out the direct effects, and only looked at users who didn’t click.
The result: users who played the game, had a much higher tendency to purchase from the advertiser later on through a different source. The conversion within this group ended up 30 percent higher than the audience that did see the billboard, but did not interact.
Because gameplay is a relatively intense interaction, we looked at a more simple interaction case that asks less of the user. For a recurring lottery campaign, we used a mobile swipe cube. The results were less extreme than the first test, but there still was a significant uplift of 15% in post view conversions in comparison to the audience that didn’t interact with the ad.

All tests up until now show interaction within a creative shows a significant indication of the effect of the ad in the consumer journey. Let’s let go of our CTR tunnel vision, and misleading post view models. The indirect effects can have an important contribution to the final result. Make this insightful.


Leave a Reply
You must be logged in to post a comment.