
In 2016, we celebrated our two years anniversary. In the past year, besides all the great posts on analytics, data science, and code, we’ve again published tons of good content about a variety of subjects, like artificial intelligence and a Slack integration for Pokemon GO. If you wondering where we come from, check out our first post where we talk about our core beliefs and ideas. In this post, we’d like to look back and dive into some analytics data.
Several interesting things happened last year because of our content. First of all, because of SEO efforts by Inge, we currently rank 1 on Google on the term ‘marketing technologist’:
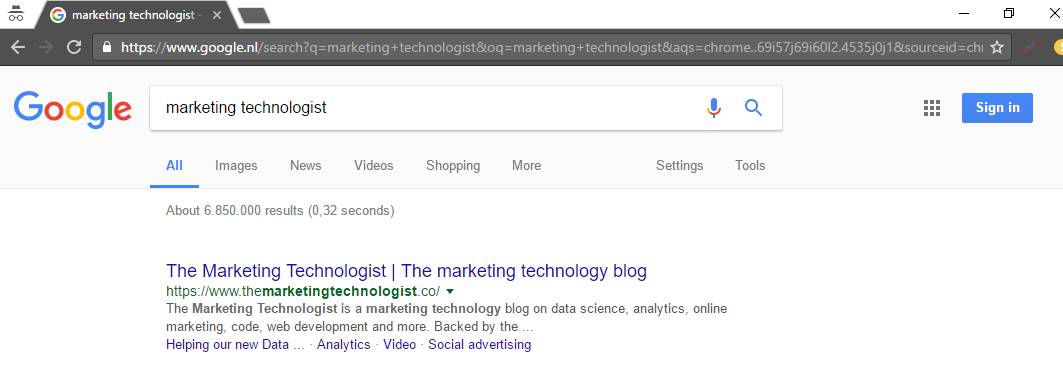
Incognito search for ‘marketing technologist’.
In international news, Thom’s post about recommendation engines got translated into two languages: Arabic and Chinese. How awesome is that? Besides that we had several clients referring to posts and asking us to set it up for them:
I’ve read [this post] on your blog. Can you set up [x] for us?
Content is turning into an automated source for new projects! We’ve also seen an increase of guest bloggers, which is great! We’d really like to see more experts share opinions here. If you fancy writing for The Marketing Technologist, just drop us a line at Twitter.
Looking at the data
We’ve had 254.716 visits to our website and 27.5% of these resulted in a full read of a post. We had a generally upward trend starting with roughly 1500 weekly visits in January and ending up with 7.500 in December, that’s a 400% increase in weekly visits! Looking more closely at the trend, we had two major traffic peaks:
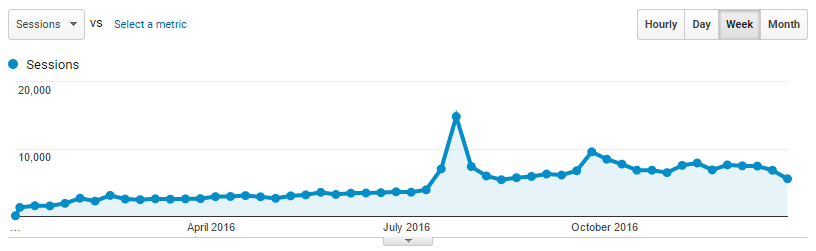
TMT weekly traffic trend of 2016.
We had the first peak around July 25 with our Pokemon Go Slack Notifications post, and one on September 30 with the post to help new data scientists in python. These two posts give a nice indication of the variety of topics on TMT.
Content performance
As you might know, we’ve setup content performance tracking back in 2015. Because of this, we can drill down in our content’s performance. We’ve had 79.714 fully read articles, consisting of 77.874.643 words in total (only including full reads!), making the average read post length on TMT 976,93. With the threshold for large content at 1000+ words, this average tells us that large content performs well on TMT. If we take a closer look at the performance of content size, we get the same results:
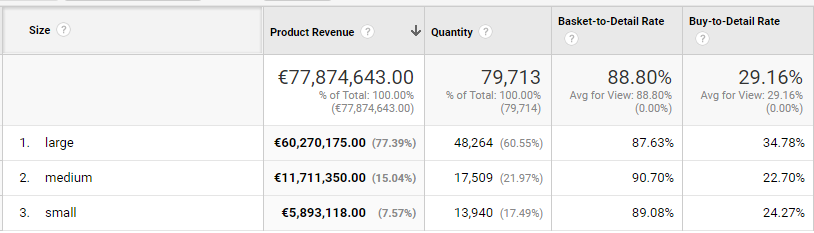 TMT content size performance of 2016.
What’s not that surprising is that large content makes up for a large chunk of the total read words (77,4%), these are the largest posts after all. What is more surprising, is the performance of the content. Besides having the most full reads at 48.264 (60.6%), the full read rate (Buy-to-Detail Rate) is 34,78%, beating medium content with 12,08% and small content with 10,51%! Our large content performance is 53-56% better compared to other post sizes. Large posts work well on TMT.
The top posts
We see something interesting in our top 10 most read post:
- Passing data to and from a nested component in Angular
- React Router: a comprehensive introduction
- Google OAuth 2: access data from a Google user in your application
- Introduction to data binding in Angular 2 versus Angular 1
- Caching $http requests in AngularJS
- Helping our new Data Scientists start in Python: A guide to learning by doing
- Send Slack notifications whenever a Pokémon spawns nearby using a Pokémon GO SlackBot
- Creating dynamic videos using JavaScript and After Effects: the basics
- How to update out of date npm dependencies
- Angular 2: Where have my factories, services, constants and values gone?
The number 2, 3, 5, 8, 9 and 10 posts were published in 2015 (that’s 6 out of 10), indicating that this is valuable content and the subjects are still relevant. Of course, we track detailed information in Google Analytics with word count (product revenue) and quantity (amount of reads):
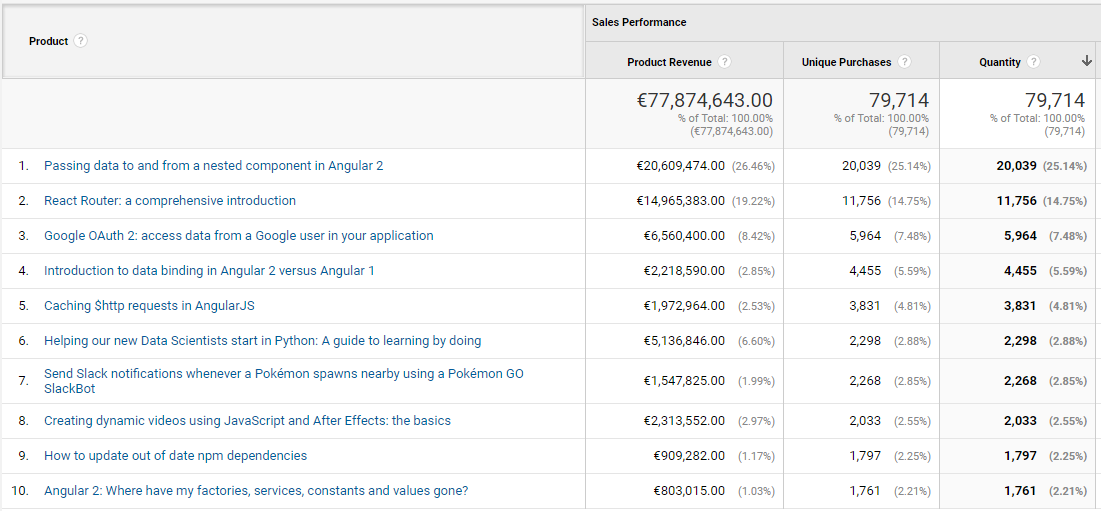
TMT content top 10
We can remove the non-2016 posts from the list to get the most popular posts published in 2016:
- Passing data to and from a nested component in Angular
- Introduction to data binding in Angular 2 versus Angular 1
- Helping our new Data Scientists start in Python: A guide to learning by doing
- Send Slack notifications whenever a Pokémon spawns nearby using a Pokémon GO SlackBot
- Upload your local Spark script to an AWS EMR cluster using a simple Python script
- A recommendation system for blogs: Content-based similarity (part 2)
- Api.ai vs Wit.ai (or is it Google vs Facebook?)
- How to start a WhatsApp conversation directly from the web
- Google Analytics’ new event metrics explained
- The differences between Adobe Experience Design and Sketch App
The shift in top 10 posts shows us the importance of asking the right question. Do we want the most-read post of 2016, or the most-read posts published in 2016?
If we look at subjects, we see that 4 posts ar about development (1, 2, 8 and 10), 3 are about data science (3, 5 and 7), 2 about upcoming technologies (4 and 6) and one is about analytics (9). The amount of fully read analytics posts is dwarfed by the other subjects. Because of this, we assume that technical analytics is a niche (we do get a constant flow of a few reads a week). We see this in the trend of our three main post categories:
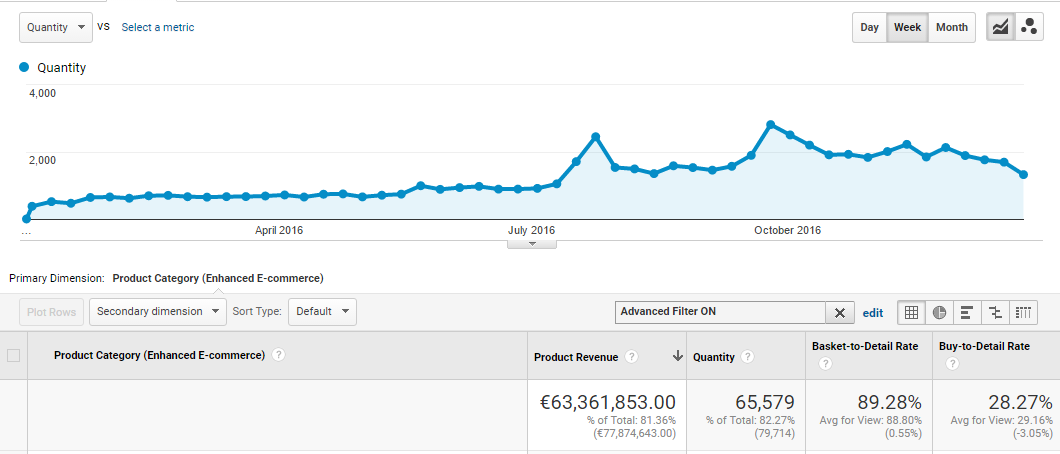
1. Trend of code posts
Our coding posts make up for most of the read content. The volume of read content also increased significantly throughout the year.
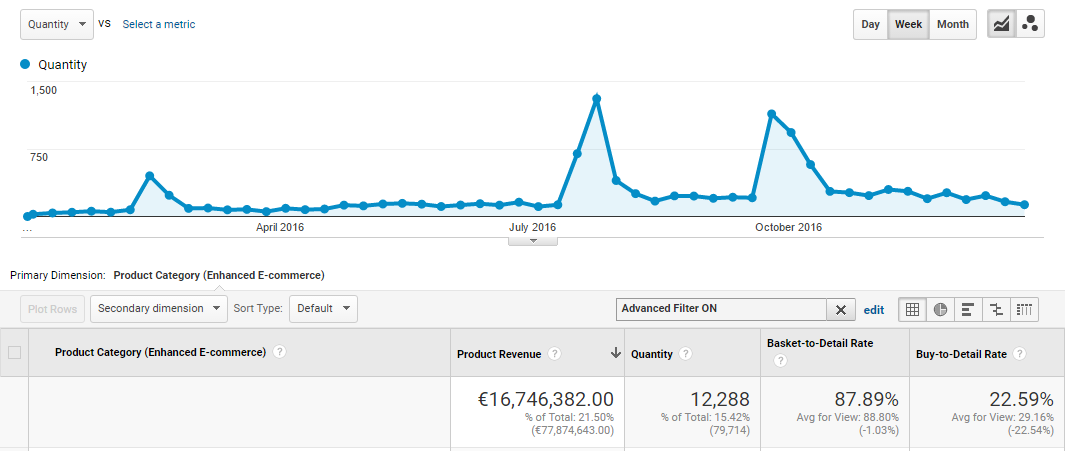
2. Trend of data science posts
The data science related posts have a constant flow of reads and were good for the 2 major traffic peaks we discussed earlier. Just as development, the number of read words increased throughout the year.
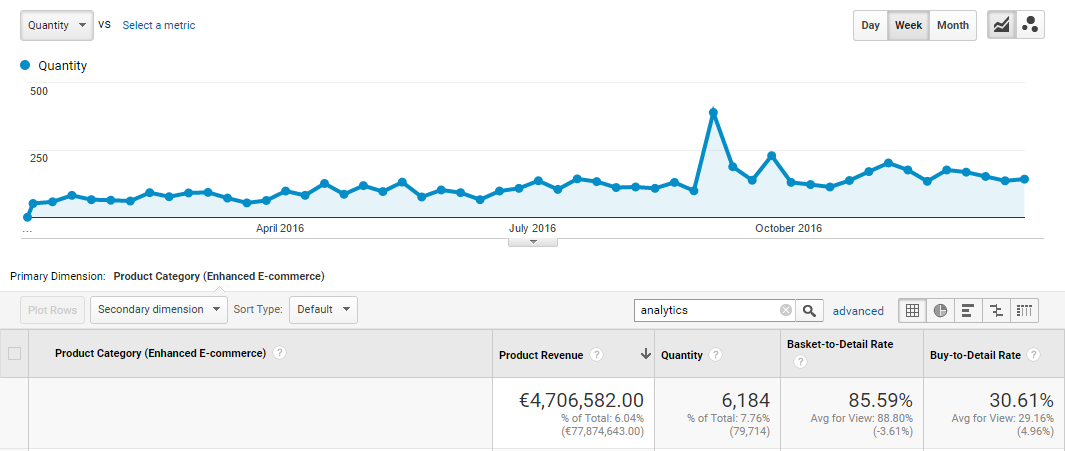
3. Trend of analytics posts
Analytics has very constant flow of read articles, increasing only slightly as the year passes. It’s interesting to see that the full read rate (Buy-to-Detail Rate) is the highest of the three topics. The peak is related to a post about the new event metrics in Google Analytics, which Google somehow release without any documentation.
The top authors
Besides analysing content based on title, we can set up a list of top authors in as well. And we can do so in three:
- amount of words read;
- amount of articles read; or
- full read rate (how many people that open an article also read it?).
Let’s have a look:
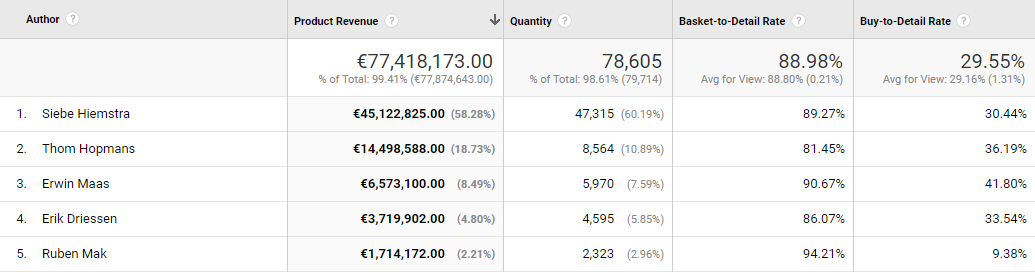
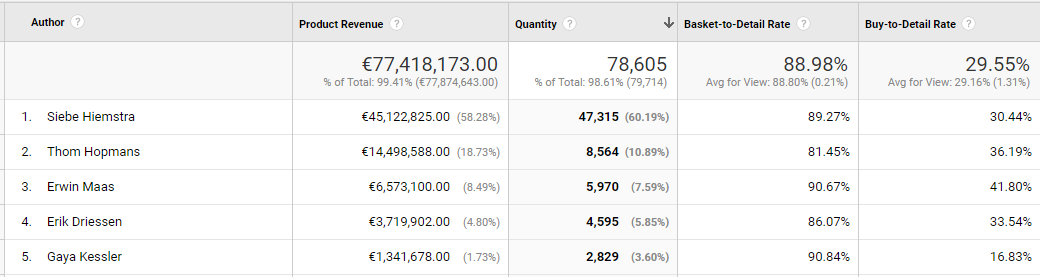
1. Top authors based on amount of words read
The top 5 authors correspond with the popular topics, both Siebe and Erwin (number 1 and 3) write code related posts, Thom and Ruben (number 2 and 5) write about Data Science, and I (number 4) write about analytics.
2. Top authors based on amount of arcticles read
If we switch to quantity, ignoring the number of words, Ruben drops out fo the top 5 and Gaya enters.
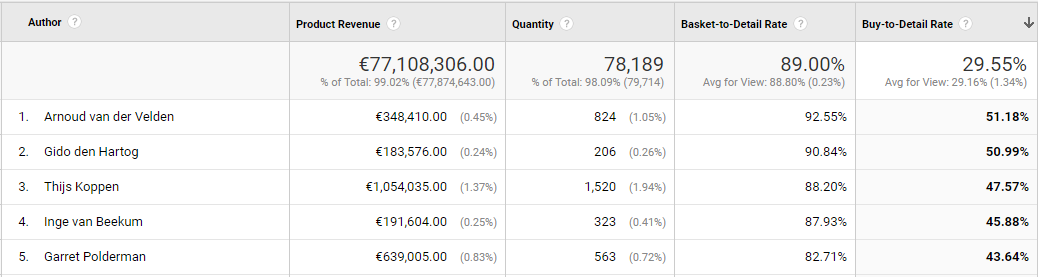
3. Top authors based on full read rate
Switching to full read rate changes the top 5 completely. Everyone who was in the top 5, is gone now. These authors post less, but when they post, readers are likely to fully read their posts.
Applying updates
Getting the performance of only the 2016 post was quite a hassle, we didn’t add any publication date information to the post. Because of this, we manually have to exclude 2015 posts to get our top 2016 posts:
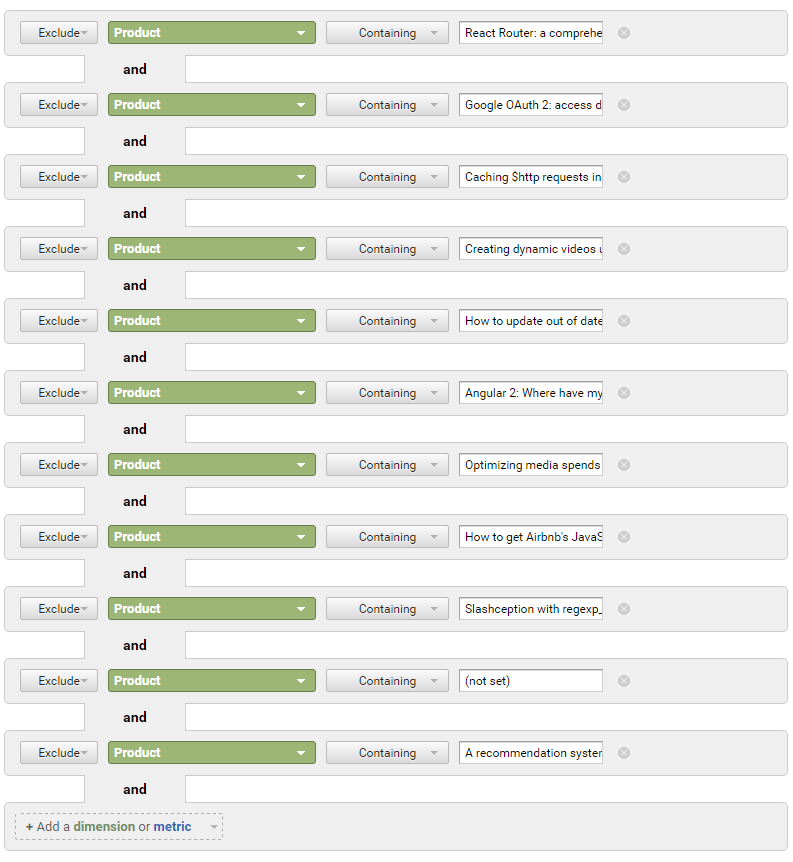
TMT manual post exclusion filter.
Of course, this would be way easier if we collect the right data. So now, we’ve added the post’s month and year as custom dimensions:
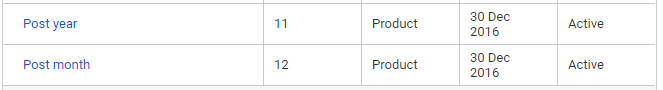
TMT new custom dimension for post year and month tracking.
Because of this change, the filter will be way easier next year:
 TMT new custom dimension for post year and month tracking.
Final words
In the next year, we’re eager to post even more quality content on The Marketing Technologist, and we could use your help with achieving that goal. We’d really like to see more experts share opinions here, so if you fancy writing for the Marketing Technologist, just drop us a line at Twitter.
Have a great 2017!
This post was co-written by Siebe Hiemstra.


Leave a Reply
You must be logged in to post a comment.